A global picture of the EV market
Tiny share yet impressive growth!According to the IEA, only around 17 000 electric vehicles (EV) were on the road globally in 2010. In 2019 this number climbed up to 4.79 million! That is more than a steady 180% increase year-on-year! Yet, globally, there are more than 1 billion cars in use which makes the EV fleet less than half a percent. Still, this impressive growth over the past 10 years raises big questions for the future. When will electric surpasses combustion vehicles? Which EV model is selling best? Can gas stations switch to charging stations at the same pace? What does it take to accelerate or decelerate this transition? Which countries are ahead in EV deployments?
Well, it turns out that there are humongous disparities in the growth of EVs across the globe. Take a look at 2019 car sales. Look at how Norway is way ahead in EV sales share!
Closer look at Norway
Secret recipe to EV fertilitySuch a feet in respect of global performance raises questions on how it can be achieved. First and foremost, lets look at the top EV models sold in Norway from their respective releases until mid-2020.
Nissan Leaf started 10 years ago so it benefits from the top spot compared to the notorious Tesla model 3 which made its debuts a year ago (only!). It is obvious that there must be a reason behind these numbers. Are Norwegians extremely concerned about the environment? Well not more than their neighbour countries (Greta is not Norwegian). Additionally, Norway is the country which produces the most petrol in Europe (after Russia)! So what is the secret? Well ...
When it comes down to choosing a new car, EVs are still significantly more expensive with respect their fossil fuel counterparts. But thanks to government policies this does not have to be the case everywhere. Indeed, at the time where quasi no EVs could be found on the roads, a whole series of government policies were set in place in Norway. The most significant two were:
- 1991: The “one time fee” roughly doubled the price of each car except EVs
- 2001: A VAT exemption was allocated to EVs
Yet with all these measures, it took another 10 years until the EV growth started to kick in. And compared to the rest of the world, this fleet share growth is simply put, jaw dropping.
Let’s start digging
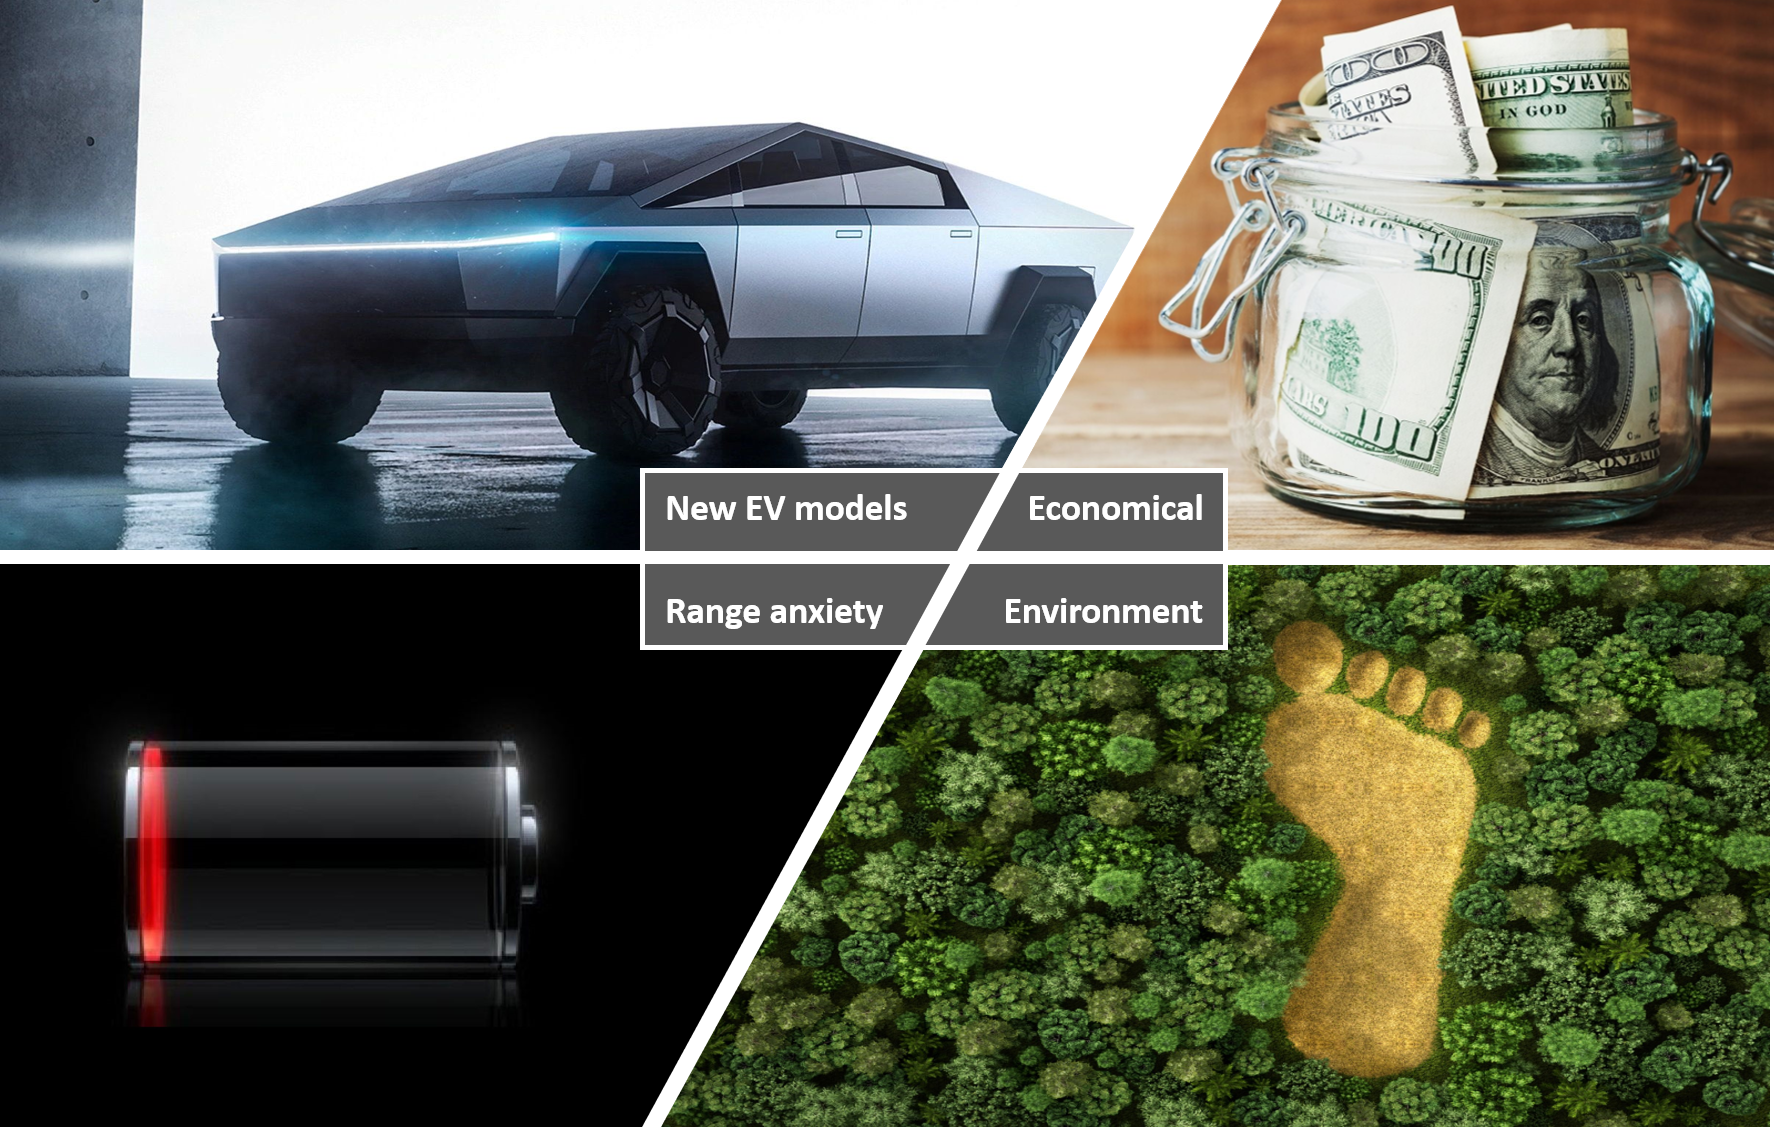
Python is our favourite shovelThe plot above raises some interesting concerns. What triggered the sudden growth of EV sales in Norway and what sustains it? Lets start by analysing the consumer behaviour in respect to switching from dirty gasoline to “clean” electric into four categories which can directly influence their choice.
Now that we have these categories, how do we assess which category affects the most the decision of consumers?
EV cornerstone dates
Events which fuelled EV growth (or not!)The Opplysningsrådet for veitrafikken (Norwegian Road Traffic Information Council) gave us access to weekly numbers of sales of all vehicles and EVs in Norway from 2010 until today. With such a dataset, a detailed view of the evolution of the EV market share can be displayed below.
On top of this evolution 4 key event are displayed which can be split in our 4 categories.
New EV models on the market:
- December 2010: Nissan Leaf first release
- February 2019: Tesla model 3 first release
Range anxiety concerns:
- July 2013: Tesla supercharging system start
Environmental awareness:
- April 2015: COP21 - Paris agreement announcement
Economical factors:
- Between 2010 and 2020, no major events are worth mentioning related to economical factors in Norway. All most important measures have been set in place before 2001.
Regarding these four dates, lets see if a paradigm shift in market share was done. It seems like a sharp short-term growth is noticeable after the Paris agreement and even more on the first deliveries of the Tesla model 3. Furthermore, the introduction of Tesla superchargers seemed to have had a strong and lasting impact. To get more insight, lets apply some discretised ordinary least square regressions. The idea here is to see how each event affect the offset and slope of the EV sales across time. As dates are not always exact and a time to action should be considered between the event and actual EV purchase, a grace period of 1 month was added. This means that 1 month of datapoints after the event is not accounted for in the regression. Furthermore, as seen in the plot EV fleet share in %, the market share evolution of EVs is quadratic. In that sense the slope will only increase with time. To remove this effect and have a more interpretable slope change before and after the event, we linearised the EV share by taking its logarithm. The results for our four dates are the following:
For these results it seems like the Nissan leaf and the Tesla superchargers had the most impact on EV sales. Although less mediatised than Tesla, Nissan leaf was really the car which made EV accessible for the mass market. The Tesla model 3 shows a big growth right after release but this growth doesn’t show itself to be steady in time. It even seems like the trend is dropping for the remaining points after the release! On another hand, it doesn’t seem like the growth of environmental concerns brought by the Paris climate agreement made a paradigm change in EV purchases. This method yields interesting results but has two key drawbacks.
- We cannot assess the impact of economical factors on the consumer behaviour as we do not have any major events within this 10-year window.
- Some other nonrelated events may superpose in the background which may also influence consumer behaviour. This makes it hard to dissociate categories among each other and avoid confounds.
Another method is clearly needed to draw some stronger conclusions...
Google trends
Google never liesWhy not investigate what consumers search for on the web before they buy an electric vehicle? The idea will be to investigate search patterns within these four categories and align them Norway’s EV market share. A Google has a ready made tool for that !
You can narrow historical data of search queries to a specific timespan and region. Up to 5 keywords can be compared among each other. The values are on a scale of 0 to 100% where 100% is the data point for which a single keyword has been the most solicitated. Among the keywords with data, we considered the ones which best represented each category in relation with EVs. Some are chosen to match specific incentive policies. For example “Electric vehicle parking” is chosen because EV’s in Norway get free access to public parking spots. Others are more obvious, like “Electric vehicle price”. The trends of these keywords are shown here.
Quantifying motivations to buy EV's
Put your money where your mouth isWhen trying to understand someones motivation to do anything the easiest thing to do is just ask them. In a study reported by Fortum, Norwegians themselves report climate and environment as the main reasons for buying electric. But of course the moral high ground is a pleasant place to be, or at least seem to be. There is wisdom in the old saying "Look at what a person does, not what they say". If we are to understand what motivates EV-buyers it mght be better to let peoples own behaviour speak for itself.
Buying an electric car is usually not done on a whim, and some research is called for ahead of a purchase. Could peoples search patterns on Google tell us about whats most important to them? If so, that means it is possible that their search patterns can be used to better inform a prediction model for the evolution of EV market share.
Using google search patterns to improve prediction models was demonstrated in a 2009 paper by Choi & Varian titled "Predicting the Present with Google Trends". The concept is quite simple. Add the search pattern data provided by Google Trends to an Auto Regressive (AR) model, and see if this model is better at prediction compared to an AR model without Google Trends. If certain keywords from google search trends leads to better prediction, then that is a strong indicator of a very real motivation to buy electric.
In the above plot you see the performance metrics of 20 AR-models, each fitted with the Google Trends data signified by the keywords on the y-axis. On the left Akaike's Informatino Criterion (AIC) is displayed, which is a common metric to use in order to evaluate how well a model fits the data it is trained on. A lower value of AIC signifies a better fit. However, A better fit does not necessarily lead to prediction efficacy on data the model has not seen before.
An intuitive way to compare model performance is to sum up the absolute value of all the errors made by the model, and finally dividing by the mean. This is called Mean Absolute Error, which is displayed on the right. In this plot, the MAE of the model with a keyword is displayed as a percentage improvement from the model without a keyword.
However, individual performance does not neatly lead to combined performance. When using several keywords in the same model, some keywords that had good individual performance does not lead to an overall improvement, while some keywords with a lesser improvement combines very well with others. With some experimentation the highest MAE for one model is achieved using the keywords "Electric vehicle fee", "Electric vehicle parking", "Electric vehicle price", "Tesla", "Nissan Leaf", with an MAE improvement of 3.68%. The final model (green), and the baseline model (orange) is shown against empirical market share (blue) in the graph below. Predictions only start some time into 2011, because the period before that was used for in-sample training of the model.
Only economic and EV-model specific keywords were used to obtain this model. Keywords concerning environment, such as "Carbon Footprint", despite showing good individual performance does not help improve a combined model much at all. This result is in stark contrast to Norwegians self reported reasons for buying EV's.
Conclusion
Bright future ahead?Could it be true? Is economic and EV-model enthusiasm the main driving factors leading people to buy EV's? It certainly seems that way when attempting to make predictions. But perhaps we are being too cynical?
We do not solely rely on the Google search engine in order to inform ourselves about a subject matter. The desire to abandon the combustion engine as a mode of transport can be formed by ingesting news, discussions with friends and family, or seeing the product for yourself. Not all of which is necessarily captured by our Google searches.
There are technical challenges in this methodology as well. In this project car registration is used as a proxy for car sales. The registration of a car can happen quite some time after a car is bought, and that is not even considering this time delay if the car is pre-ordered. These factors could be obscuring relevant results.
But if it is true that Norwegians are far more motivated by fiscal rather than environmental concerns, then politicians need to be very careful with making changes to the current system of incentives. In recent times some of Norway’s politicians have stated their intention to remove the VAT exemption from certain EV models. The VAT discount is significant enough that it is currently cheaper to buy a Volkswagen e-Golf than a regular Golf. A report made by Norway’s Automobile Association stated that the established market share for EV’s could fall drastically if the current incentives are removed prematurely.
In 2021 the VAT exemption for EV’s will expire. If it is to be continued, it will need to be renegotiated by the government. Coincidentally, the government is up for re-election the same year. It might very well be the case that the market share currently enjoyed by EV’s in Norway could be significantly reduced.
Project video
A short video summaries the analysis and findings detailed in this datastory.